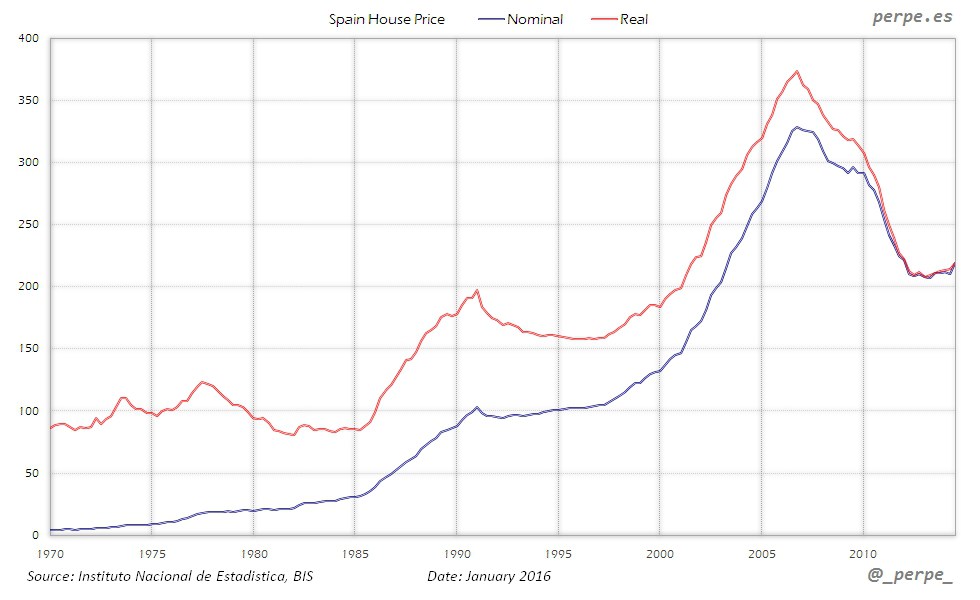
The evolution of house prices is clearly visible in this chart made with data from the National Institute of Statistics and published in the blog Perpe. Since 1970 is seen a consecutive increase much more visible among the period from 1995 to 2007 which clearly coincides with speculation before the real estate crisis, reflected in the range of 2005 to 2010, falling dramatically.
In the graph is visible the beginning of a slight increase since 2012 and approximately suggesting the recovery in the sector.